Reports & analytics
Customer service reports that open the chats behind the number.
Chats, the chatbot, tickets, sales and surveys are reported in the same app that handles them. Click a number on Reports → Chats and History lists the chats it counts. Open one and read it.
- Reports on
- Chats
- Chatbot
- Tickets
- Sales
- Surveys

Reporting today
The number moved. Nobody can show you which chats moved it.
“I export to a spreadsheet to find the chats.”
A dashboard shows 42 hand-overs. Finding the 42 conversations is a separate job.
“Chat reports here, ticket reports there.”
When the inbox and the helpdesk are two tools, nobody sees one customer’s whole week.
“The bot says it deflects 60 %. Of what?”
A deflection rate without the reasons behind each hand-over is a number to argue about.
Chats
Every chat counted by day, channel, agent, team and skill.
Reports → Chats shows how many chats came in, who resolved them, how many the bot settled and how many it handed over. Filter by channel, team or agent. Each count opens the chats behind it.
- Abandoned in the queue or with the bot, counted apart
- Bot containment and hand-over rate
- Transfers, first response and duration

Reports → Chats for Teras Home: 123 bot chats, 67 resolved by the bot (54 % containment), 42 handed over, and the chats by day.
Chatbot
Where customers leave each flow, and why the bot handed over.
Reports → Chatbot splits WhatsApp from web chat and lists every step of a flow with how many customers reached it and stopped there. Hand-overs come with their reason: the customer asked for a person, or the AI had no answer.
- Settled without a person, by channel
- Drop-off for every step of every flow
- The questions the AI couldn’t answer
By channel, then the Teras Home main menu step by step: 84 customers reached the AI answer and 13 stopped there.
Tickets
SLA compliance, first response and resolution, in your business hours.
Reports → Tickets measures time the way your SLA does: in business hours, or on the clock if you prefer. Resolution time leaves out the hours spent waiting on the customer. Every number opens the tickets it counts.
- SLA compliance: met ÷ (met + breached)
- Reopen rate and the backlog by age
- By agent, team, category, policy and source

Teras Home’s tickets, each with its team, priority and source: the fields Reports → Tickets breaks its numbers down by.
Right now
The live monitor shows the chat floor as it is now.
Reports tell you about last month. The monitor shows who is available, how many chats each agent has, what’s waiting and which chats are close to an SLA breach. Open any chat from it.
- Every agent’s load against their cap
- The queue by channel, team and skill
- SLA at risk, with a link to each chat

Teras Home’s monitor: 10 live chats, 3 of 6 agents available, nothing at risk.
One menu
Sales, surveys and support in the same Reports menu.
The lead funnel, deal analytics and Reports → Sales sit next to tickets, surveys, agent performance and the chatbot. They all count the same customers, so the numbers agree.
- Reports → Sales: AI-qualified, booked, held and won
- Reports → Surveys: response rate, CSAT and NPS
- CSV exports that run in the background

Reports → Sales in our demo workspace, beside the Reports menu: CRM, support, and chat and queue reports in one list. The numbers are the demo workspace’s seeded leads.
Connected to everything else in Axonave
The reports count the same records your team works on.
There is no data warehouse to sync. A report reads the chats, tickets and deals in the same workspace, so a click on a number lands on the real conversation.
One customer recordchats · tickets · deals · AI answers
- Omnichannel InboxWeb chat and WhatsApp
- Chatbot & Flow BuilderAnswers saved to the CRM
- AICited answers, hand-over
- Knowledge Base & Help CentreWhat the AI answers from
- HelpdeskTickets with SLAs
- CRMLeads from every chat
Omnichannel inbox
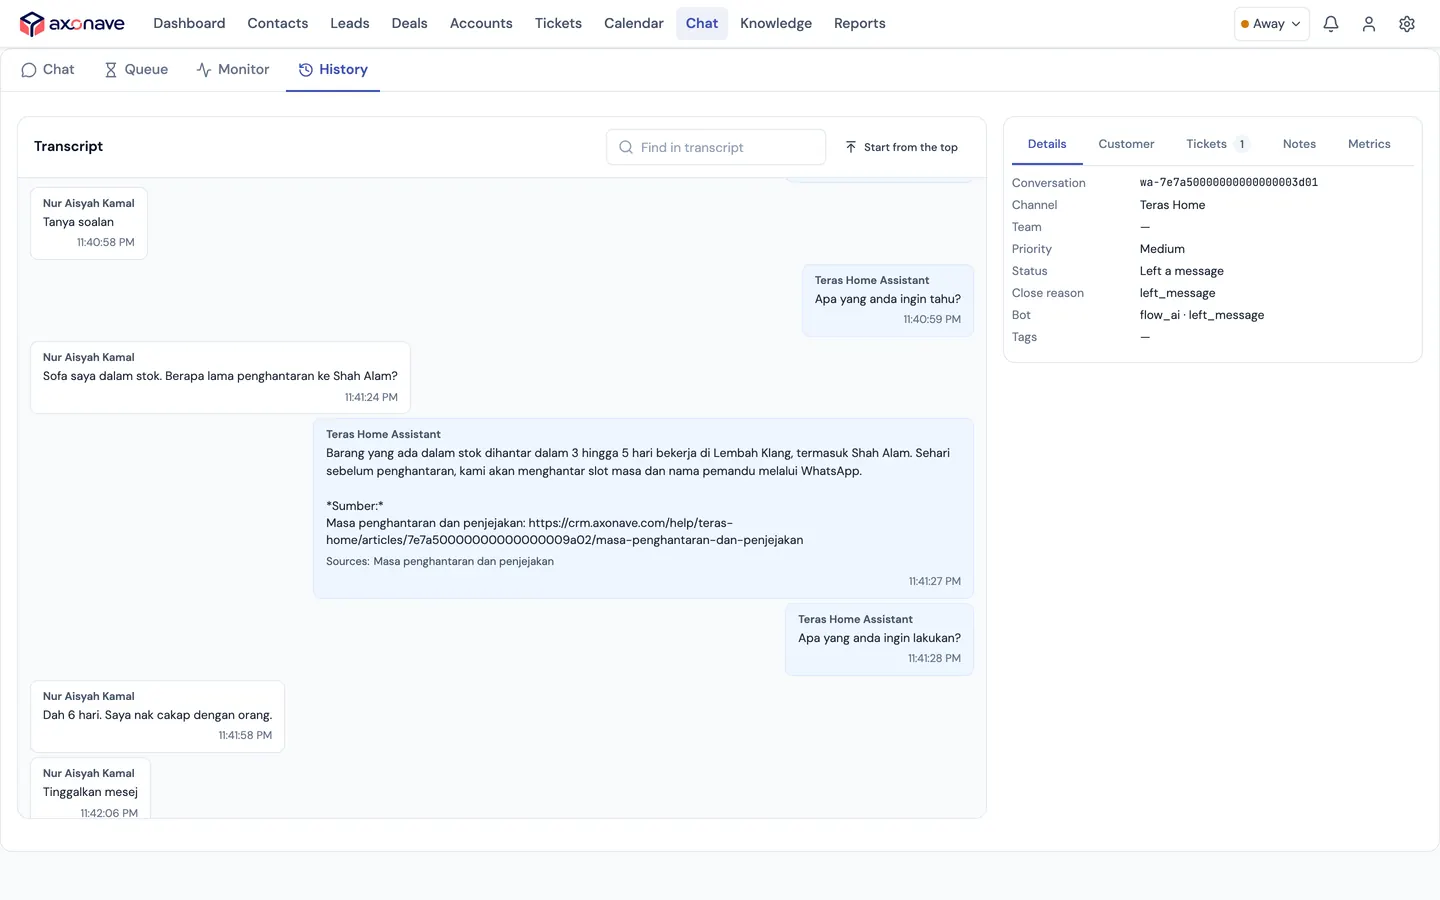
Every chat a report counts is in History, with its transcript.
Helpdesk
Ticket reports in business hours, by the same SLA policies.
Chatbot
Drop-off per flow step and the reason behind each hand-over.
AI sales agent
Reports → Sales, from qualified lead to won deal.
From a number to the chat
The report says 42 hand-overs. Two clicks later you’re reading one.
Every count on Reports → Chats is a link. It opens History with the report’s own filter already set, so the list holds exactly the chats in the number.
Click the number.
Handed over: 42, the chats Teras Home’s bot passed to a person in the last 30 days.
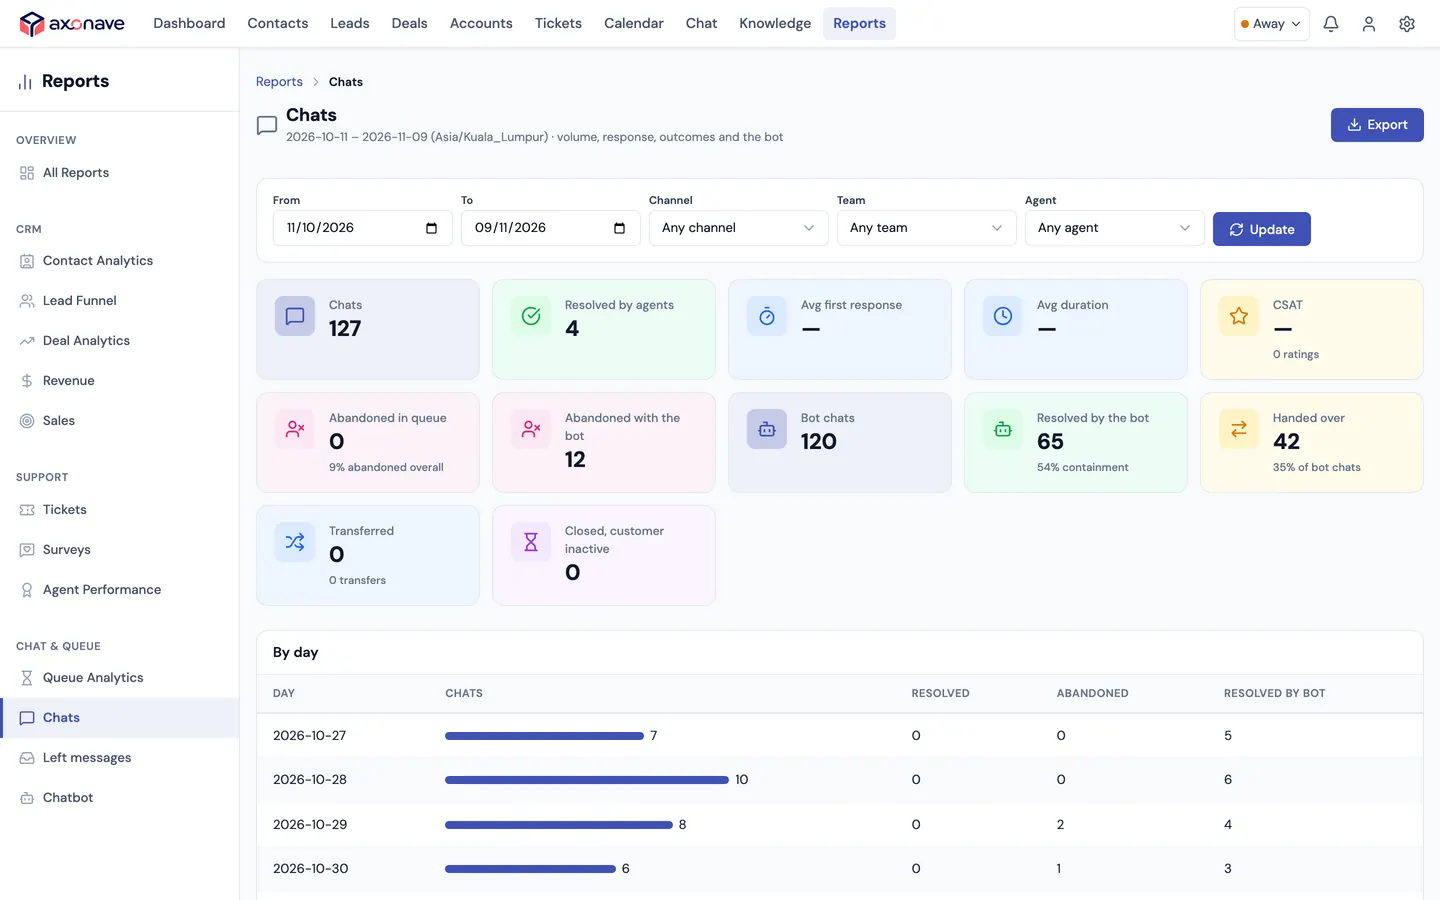
History opens on those 42 chats.
The same filter the report used, already applied. No export, no spreadsheet, no guessing which chats were in the count.
Open one and read it.
The transcript, how the chat ended, its tickets, notes and metrics. This is Nur Aisyah Kamal’s after-hours WhatsApp, which ended with a message for the team.

Who reads them
Support leads
Monday’s hand-overs and SLA breaches, then the chats and tickets behind them.
Bot owners
The flow step where customers give up, and the questions the AI couldn’t answer.
Sales managers
Leads the AI qualified, meetings booked and held, and deals won, by source.
Questions about reports
Which reports come with Axonave?
Contact analytics, the lead funnel, deal analytics, revenue and sales on the CRM side. Tickets, surveys and agent performance for support. Queue analytics, chats, left messages and the chatbot for chat.
Can I see the chats behind a number?
Yes. Every count on Reports → Chats opens History filtered to exactly the chats it counts. On Reports → Tickets, each number opens the tickets behind it.
Do the reports stay fast with a lot of chats?
Yes. Chat and ticket reports are built from daily rows that are kept up to date in the background, so a 90-day report doesn’t read every chat again. Today is always read live.
Do ticket reports count business hours?
Yes, by default. Durations count your opening hours and holidays, the same way your SLA does, and resolution time leaves out the time spent waiting on the customer. You can switch to clock time.
Can we export the data?
Yes. Chat exports run in the background as CSV, or as a ZIP of transcripts, for all chats, bot chats, abandoned, assigned or resolved. Ticket reports export to CSV too.
Is CSAT in the reports?
Yes. Reports → Surveys shows the response rate, CSAT and NPS, every question’s answers, and filters by agent, team and channel.
Which plan has reports?
Every plan, for the modules it includes. Basic is $59 a month with the CRM, the helpdesk, live chat and WhatsApp.
Is there a free trial?
Yes. Try Pro free for 14 days. No card needed.
See your own numbers, and the chats behind them.
We reply within one business day by email or WhatsApp.